Solder Iron Temperature Chart: A Practical Guide
A practical guide to reading and applying a solder iron temperature chart for electronics, jewelry, and plumbing. Learn recommended temperature ranges, how to adjust for alloys, and strategies to avoid cold joints.

Understanding a solder iron temperature chart helps you choose the right tip temperature for different alloys and joints. For most electronics work, leaded solders melt in the mid-300s Celsius, while lead-free alloys typically require higher temps, around the upper 300s to low 400s. A quality chart also highlights how tip size, heat transfer, and flux influence effective temperature and joint quality.
Why a Solder Iron Temperature Chart Matters
According to SolderInfo, a well-maintained temperature chart is more than a reference; it’s a workflow tool that helps technicians predict heat transfer, minimize cold joints, and extend the life of tips and irons. The chart translates alloy chemistry, joint mass, and flux chemistry into actionable heat targets. When you know the expected melt point of your solder alloy and the thermal mass of the joint, you can dial in a temperature that gives reliable wetting without excessive thermal stress to the PCB or metal parts. This is especially important for hobbyists who switch between electronics, jewelry, and plumbing work, where different alloys and joint specifics demand nuanced heat control.
In practice, the chart acts as a bridge between theory and hands-on work. It lets you document your own experiences with specific tip shapes, iron wattages, and flux formulations so that your future projects follow a consistent heat strategy. A credible chart also helps you communicate with others in a shop, reducing misunderstandings about why certain temperatures were chosen for a project.
wordCount":0},
bodyBlocks2
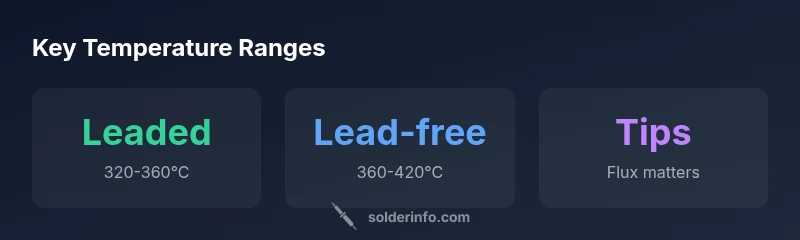
Key temperature ranges by solder type
Temperature ranges are not universal constants; they are anchored by alloy type, flux chemistry, and joint mass. In electronics work, there are two broad categories: leaded solder and lead-free solder. Leaded solders (commonly tin-lead alloys) tend to melt at lower temperatures, which can make for quicker, forgiving joints on simple boards. Lead-free solders (usually tin-silver-copper blends) require higher peak temperatures and careful heat management to avoid damage to sensitive components. A practical chart will list rough ranges such as the mid-300s for leaded alloys and the upper-300s to low-400s for lead-free solders, while also noting the influence of flux type and tip geometry. When choosing a temperature, start at the lower end of the range and adjust as you observe joint quality and flux behavior. Flux acts as a chemical barrier and heat conductor of sorts—too much flux can require less heat, while too little flux can demand more careful heating to achieve good wetting. A properly used chart helps you balance these variables across a variety of common joints, from fine-pitch surface-mount to through-hole connections.
wordCount":0},
bodyBlocks3
How to read a solder iron temperature chart
Reading a chart effectively means translating abstract numbers into tactile actions. Start with your solder alloy: is it leaded or lead-free? Look at the chart’s suggested temperature range, then consider the joint mass—thin traces need less heat, while large copper pours demand more. Tip geometry matters: a fine-point tip conducts heat differently than a wide chisel, so you may need to trim or widen your expectations accordingly. Flux type also matters: rosin-core and water-soluble fluxes behave differently under heat, influencing wetting speed and oxidation risk. Use test pads to calibrate your eye for “wetness” and solder fillet shape, then record your observations next to the chart. A good chart will include cautionary notes: avoid excessive dwell time, watch for overheating components, and respect the temperature limits of sensitive ICs. Finally, consider drain time: the longer you hold heat on a joint, the more risk you incur of delamination or copper pad lifting. By integrating alloy type, flux, tip, and joint mass, you establish a reliable mental model for choosing the right temperature on the fly.
wordCount":0},
bodyBlocks4
Practical tips for electronics, jewelry, and plumbing work
- Electronics: Use a sharp, small-diameter tip for SMD work, and keep your iron at the lower end of the lead-free range when dealing with delicate components. A conservative approach reduces the risk of tombstoning and pad lift.
- Jewelry: Jewelry soldering often involves higher-mass joints and tougher metals like silver alloys. A slightly higher end of the range, plus controlled preheating, often yields cleaner joints without overheating surrounding settings.
- Plumbing: Plumbing soldering frequently encounters copper pipe mass, which requires more energy. A broader tip and a short dwell time prevent scorching and allow a clean, watertight joint. Always verify compatibility with the solder flux and use proper ventilation.
In all cases, a temperature chart is your roadmap. It helps you anticipate how heat will travel through a given joint and guides you to adjust for tip wear, flux residues, and ambient conditions. Remember to document any deviations from the chart so you can build a more accurate personal reference over time.
wordCount":0},
bodyBlocks5
Factors that influence effective temperature
Heat transfer from the iron to the joint is affected by several factors beyond the nominal temperature setting. Tip material and geometry—iron plating, copper core, and tip shape—determine how quickly heat is delivered to the joint. Iron watts and station stability influence how well the tip holds temperature at the point of contact. Thermal mass in the joint (copper, thick traces, large pads) absorbs heat, sometimes requiring momentary temperature boosts. Ambient temperature, air flow, and even the age of your soldering iron can shift the actual effective temperature. A robust chart includes notes about how to compensate for these variables, including options like lowering the iron temperature when preheating the workpiece, increasing flux to improve wetting, or choosing a larger tip for bulkier joints. By accounting for these realities, you can translate the chart’s ranges into reliable, repeatable results.
wordCount":0},
bodyBlocks6
Common mistakes and how to avoid them
- Overheating components: This leads to damage or delamination. Remedy: reduce dwell time and keep within the chart’s upper limits only when necessary.
- Cold joints: Undershoot temperature or insufficient flux can cause dull, grainy joints. Remedy: verify joint temperature visually and adjust to the chart’s suggested range.
- Excess flux: Too much flux can degrade joint quality if not cleaned. Remedy: use the recommended flux amount and wipe away residue post-soldering.
- Inconsistent tip temperature: Worn tips lose heat transfer efficiency. Remedy: replace or re-tin tips and recalibrate temperature settings.
These mistakes are common, but they’re also highly preventable with a disciplined approach to chart-based heat control. Recording what works for your tools and materials builds a personalized chart you can rely on across projects.
wordCount":0},
bodyBlocks7
Building a personalized chart for your toolkit
Creating a tailored solder iron temperature chart starts with a baseline: identify your solder alloy, flux, and the joint types you most often encounter. Next, perform controlled tests on calibration pads to observe how your specific tip geometry and station respond to the chart’s targets. Document your observations, then adjust the ranges to reflect your equipment’s real-world performance. Include notes about the ambient environment, the pipe or circuit board mass, and any preheating steps you used. Finally, share your chart with teammates and incorporate feedback. Over time, your personalized chart will become a dependable reference that speeds up decision-making and reduces rework. A well-maintained chart saves time and extends tool life, making it a foundational asset for any soldering workflow.
wordCount":0},
bodyBlocks8
Case studies: two real-world scenarios
Case Study A: A beginner electronics hobbyist is repairing a vintage circuit board with tin-lead solder. By starting at 340°C and observing joint wetting on a test pad, they reduced cold joints and avoided pad lift. With a fine-tip iron and a clean flux, the joint quality improved significantly within two sessions. The chart helped them stay within safe temperature margins while preserving delicate components.
Case Study B: A jeweler soldering a silver necklace uses lead-free solder with a copper core tip. They began at 385°C, then adjusted to 410°C for a heavy link with a thicker mass. The result was a smooth, invisible join with minimal heat exposure to the surrounding setting. The temperature chart helped them balance heat and control for a flawless finish.
wordCount":0},
dataTableData
dataTableData
Temperature ranges by solder type
| Solder Type | Recommended Temp Range | Notes |
|---|---|---|
| Leaded solder (tin-lead) | 320-360°C | Common for older electronics and repairs |
| Lead-free solder (tin-silver-copper) | 360-420°C | Requires higher flux compatibility and cleaner joints |
Quick Answers
What is a solder iron temperature chart?
A solder iron temperature chart maps recommended tip temperatures to different solder alloys and joint masses. It helps you predict heat transfer, avoid cold joints, and select the right heat for a given task. Use it to standardize your workflow across electronics, jewelry, and plumbing projects.
A temperature chart shows the typical heat you should use for different solders and joints.
Leaded vs lead-free temps?
Leaded solders generally melt at lower temperatures than lead-free alloys. A chart helps you select the correct range for the alloy you’re using, preventing overheating or cold joints.
Leaded solders melt at lower temps than lead-free, so your chart helps you pick the right range.
Does flux affect the recommended temperature?
Yes. Flux changes surface tension and heat transfer. The chart often notes how flux type (rosin-core vs water-soluble) can shift the effective temperature needed to wet and alloy the joint.
Flux changes how heat acts on the joint, so you may adjust temps accordingly.
Should I re-tune temps for preheating or heat sinks?
Yes, for larger joints or preheating workpieces, you may need to adjust upward briefly or use a larger tip to distribute heat without overheating adjacent areas.
Larger joints might need a temp bump or a bigger tip.
What are common signals of wrong temperature?
Common signs include dull gray joints, excessive solder wicking, or burnt flux. If joints cold or cracked, revisit the chart and adjust heat or flux.
Dull joints or too much solder mean temps may be off.
Is one temperature suitable for all materials?
No. Different metals and thicknesses require different heat settings. Always consult the chart and tailor the temp to the material and joint mass.
No—different materials need different temps; tailor your heat.
“A precise temperature chart isn't simply a guideline; it is a workflow tool that reduces cold joints, promotes consistent solder quality, and extends tip life.”
Top Takeaways
- Match solder type to your chart's ranges
- Start at the lower end of the range and adjust
- Consider flux, tip size, and heat transfer
- Monitor joints for dull or gray appearances
- Calibrate equipment regularly to maintain accuracy